Class Confusion, Analyzing Fastai Model Behaviors
In my research at the University, I have found that one major weakness of mine is trying to explain how these models are working and their behavior. After enough discussion on the fastai forums, I decided to make a new widget entitled “Class Confusion”, which can be used in regular jupyter environments and in Google Colaboratory.
Class Confusion:
Class Confusion was designed so after the fastai model is fully trained, we can analyze the results easier and look at where the models weaknesses lie. This tool is both for tabular and image classification models too.
The widget works by sending in attributes of your model you want to look at, including:
- A list of classes to look at or combinations
- A list of variables to examine
My project managed to work its way into the main fastai library, and lives in widgets:
from fastai.widgets import ClassConfusion
Images:
For image classification problems, the widget works by going into the confusion matrix, finding the images that were confused, and plotting them onto the screen for the user to look at. The fastai library already has ImageCleaner, but this did not work with Google Colaboratory, a platform I do most of my machine learning work on, so I ported something close here.
As an example, I can pass in a class combination of: [('Ragdoll', 'Birman'), ('British_Shorthair', 'Russian_Blue')], call the function as such: ClassConfusion(interp, classlist, is_ordered=True) and our output looks something like so:
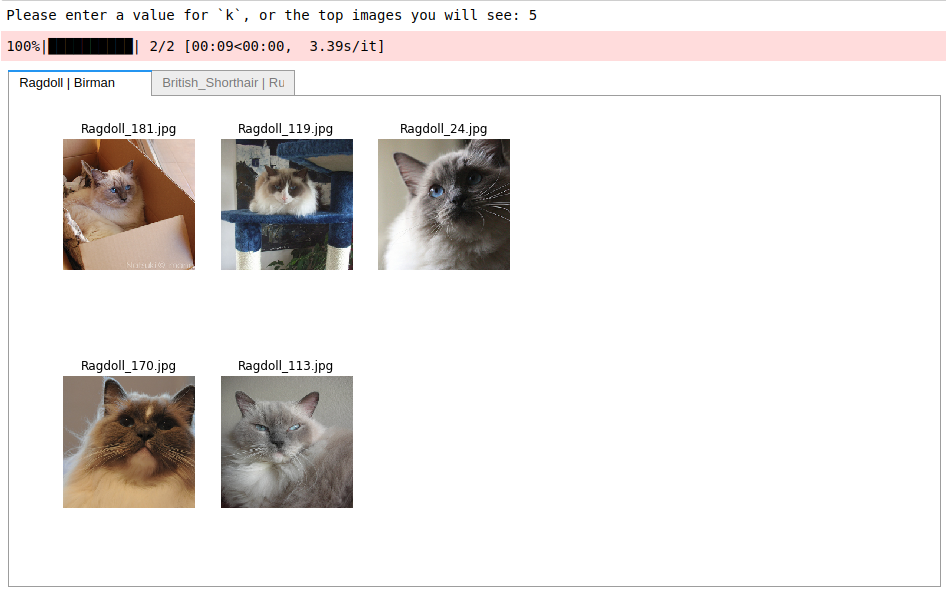
We have seperate tabs for each combination, along with the associated filename to find those images, if we want to delete them or modify them to some degree.
Tabular:
Here is where most of the bells and whistles live in the program. I designed it so we could make a better use of the Confusion Matrix fastai provides, by exploring the various distrobutions within our data.
The constructor has the varlist attribute where you can pass in specific variables to examine, else it will go through all of them. If the variable is categorical, it will go through the combination and plot the relative distributions for that particular variable. For example, using the ADULT_SAMPLE from the fastai library, I can call the function as such: ClassConfusion(interp, ['>=50k', '<50k'], varlist=['age', 'education', 'relationship']) and the result is the following set of bar graphs:

With this, there is also support for looking at the ‘True’ classifications too, where the model was correct. To do this we pass in whatever truth we want into our array of combinations along with is_ordered=True, eg: ClassConfusion(interp, [['>=50k', '>=50k'], ['>=50k', '<50k']], varlist=['age', 'education', 'relationship'], is_ordered=True, figsize=(12,12))
And out from it we receive the following distributions:

I hope this widget will help others be able to explain their models to non-ML individuals and non-Deep Learning individuals. For Colaboratory users, the repo to use is available here.
Thanks for reading!
Zach